The CECS team is proud to release the Carbon Vulnerability Visualization Tool!
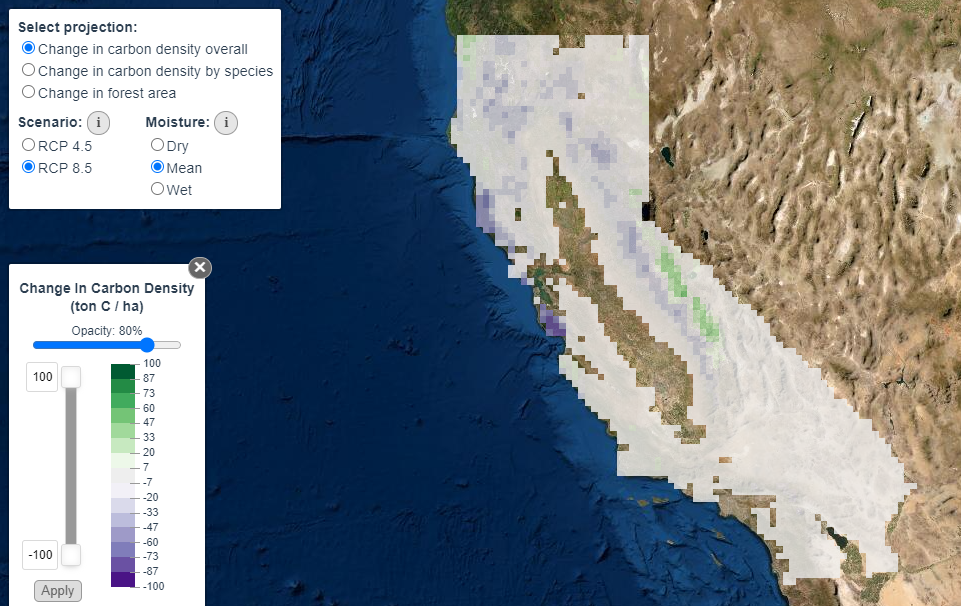
This visualization tool shows projected changes to aboveground carbon stocks across California over this century based on both moderate and extreme climate change scenarios.
These projections, built by a team of CECS researchers, are based on random forest models, using four seasons of temperature and precipitation as input. They rely on input data from the Bias-Corrected Spatially Downscaled (BSCD) product at an eighth-degree resolution (~12km x 12km) for both moderate (RCP4.5) and extreme (RCP8.5) climate change. The model is trained to fit the spatial distribution of aboveground carbon across California, provided by the California Air Resources Board. Projected changes are calculated by subtracting 2010s from 2090s. A full description of methods is available in Coffield et al., 2021 in AGU Advances. Data and code are also available for download in a public repository at https://doi.org/10.7280/D1568Z.
These projections identify which parts of the state are most vulnerable to future carbon loss due to changing temperature and precipitation patterns. Projections also include changes in tree versus shrub spread across the landscape and maps vulnerability for 20 tree species statewide.
This tool and its underlying data on the vulnerability of California’s carbon stocks can directly inform land management by anticipating the effects of climate change and targeting efforts to protect existing carbon stocks. For example, CECS researchers found that the northern coastal forests and low/mid-elevation portions of the Sierra Nevada are most likely to lose carbon to the atmosphere over this century, in either moderate or extreme warming scenarios. In the minority of climate models that project a net increase in California’s precipitation, a net gain of carbon storage is projected, but widespread losses of carbon on the order of 14% are more likely. These pose large implications for management, and can help planners and managers target management practices to the areas that are projected to be most impacted.
You can explore the Carbon Vulnerability Visualization Tool at https://cecs.ess.uci.edu/carbon-vulnerability/.
The CECS team welcomes your feedback on this work. Please contact us with your questions, ideas, and concerns.