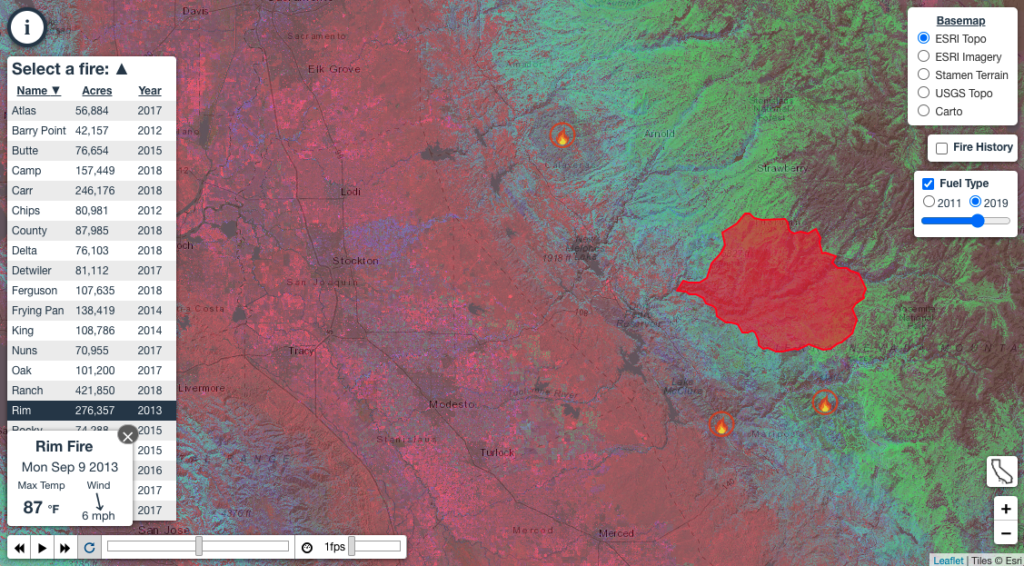
The CECS team is proud to release the Fire Progression Visualization Tool!
This new app shows daily fire spread for 32 of the largest multi-day fires in California from 2012-2020. The underlying dataset, built by CECS researchers, captures daily fire spread for all large, multi-day fires in California from 2012-2020 using active fire detections from the Visible Infrared Imaging Radiometer Suite (VIIRS) aboard the Suomi-National Polar-Orbiting Partnership (S-NPP) satellite. There are 274 individual fires currently included, spanning 3984 total fire days (the sum of days with active detections for each fire). This standardized database includes both daily fire spread rate and fire radiative power, the radiative energy emitted from fire. It will be regularly updated to include more recent fire years.
The app also visualizes fuel loads for 2011 (before visualized fires) and 2019, derived from CECS Ecosystem Integration Model, an original product that integrates geospatial data on physical conditions and a diagnostic model of pools and fluxes in order to generate data on carbon pools, water balance, die-off, and surface fuels. The Ecosystem Integration Model is evolving and will be refined over time, and it will also underpin much of the broader decision support tool CECS is developing.
This visualization tool and the underlying data add to our understanding not only of area burned but also fire behavior. Paired with climate data and information about a fire’s cause, this data allows scientists to fill in gaps about overall ecosystem impacts of fire. For example, a team led by CECS scientist Stijn Hantson (UC Irvine) has found that human caused fires are exhibiting more explosive growth in the first few days after ignition than those caused by lightning, leading to higher tree mortality.
You can explore the Fire Progression Visualization Tool at https://cecs.ess.uci.edu/fire-progression/.
The CECS team welcomes your feedback on this work. Please contact us with your questions, ideas, and concerns.

